Technical indicators are powerful tools that can help traders identify potential trading opportunities in the stock market. Indicators are essentially mathematical calculations that follow formulae, based on the price and volume of a stock. Traders use indicators to identify trends, momentum, and potential turning points. By using technical indicators, traders can gain insights into market patterns and make more informed decisions when trading stocks.
In this article, we will look at some commonly used technical indicators that many stock traders use. We will also look at how these indicators can be used to identify trading opportunities, trends, and chart patterns. Whether you are a seasoned trader or just starting out, understanding more about technical indicators can potentially improve the overall performance of portfolio.To check out the available stocks for trading in Singapore, you can visit Saxo Bank.
The basics of technical analysis
Technical analysis is one of the ways traders use to learn more about price movements of stocks that they want trade, alongside other analysis methods such as fundamental analysis and sentiment analysis. While the latter require traders to look at economic data such as inflation and interest rates and GDP, geopolitical news, and how investors feel about certain companies, technical analysis takes a more mathematical approach.
Technical analysis is the evaluation of historical price and volume data of shares to identify patterns and trends in its chart. Technical analysts believe that historical price and volume data can reveal important information about how share prices will behave in the future, which is true to an extent.
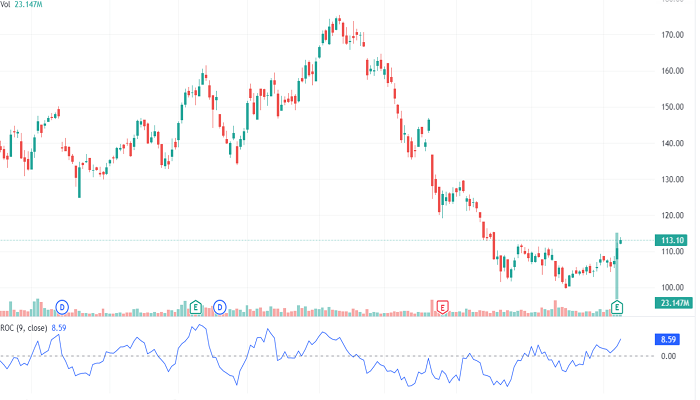
When conducting technical analysis, traders look at trading charts. Charts on trading platforms can reveal price and volume data, and these come in many forms, such as candlestick charts, line charts, and bar charts. Being familiar with all of them can help a trader spot trading opportunities more easily.
Now, let us look at three common technical indicators and how stock traders can incorporate them into their trading strategies.
Moving Averages (MAs)
A moving average is a technical indicator that helps stock traders identify trends and potential turning points in the market. It is a good tool for those who wish to find opportunities by capitalising on unpredictable (or less predictable) turns in market prices. Traders can calculate the moving average of a stock by averaging its price data over a certain period, and then smoothing out the fluctuations in price.
When do stock traders use moving averages?
Traders use moving averages to identify entry and exit points for an instrument. If the current stock price is moving above the MA, it can indicate an uptrend. Conversely, if the current stock price is moving below the MA, it can indicate a downtrend.
Two types of MAs
Two common types of moving averages are the Simple Moving Average (SMA) and the Exponential Moving Average (EMA).
Traders can calculate the SMA by simply adding up the closing prices of the stock they are interested in over a period, and then dividing it up over the number of periods. For example, a 20-day SMA for a stock would be its closing prices in the past 20 days, divided by 20.
Traders can calculate the EMA similarly, but they will assign more weight to recent price data and less weight to old price data. This means that while the SMA assigns equal weight to each data point so that the price data is treated with equal importance regardless of when it is recorded, it is not the same for EMAs.
Should I use the SMA or the EMA?
When trading stocks, traders can use either the SMA or the EMA, or both. The choice between the two depends on the trader’s strategy and preferences. The SMA is often simpler and easier to calculate, which is where its appeal lies. However, it may lag behind recent price movements, as it does not distinguish between recent and older closing prices. The EMA provides a more sensitive analysis, but it is more difficult to calculate.
The Relative Strength Index (RSI)
The Relative Strength Index (RSI) measures the strength and momentum of a stock price’s movements in the market. It ranges from 0 too 100, and traders calculate it by comparing the average gains and losses of the stock over a certain period.
When do stock traders use the RSI?
Traders use the RSI when they want to identify overbought and oversold conditions in the market. When the RSI is above 70, it indicates that the stock may be overbought, and it may encounter a pullback or correction soon. When the RSI is below 30, it indicates that the stock may be oversold, and it may encounter a rebound or reversal soon.
The Stochastic Oscillator
The Stochastic Oscillator also measures the momentum of a stock price’s movements in the market. It does this by comparing the closing price of a stock to its trading range over a certain period. Typically, that is 2 weeks, or 14 days. Like the RSI, it ranges from 0 to 100. It is based on the idea that when a stock is in an uptrend, its closing price will tend to be closer to the high end of its trading range. When a stock is in a downtrend, its closing price will tend to be closer to its low end of its trading range.
How to use the oscillator when trading stocks
Traders use the oscillator to identify overbought and oversold conditions in the market. When the oscillator is above 80, traders deem the stock is overbought. When it is below 20, traders deem the stock is oversold. In overbought conditions, the stock may be due for a pullback or a correction. In oversold conditions, it may be due for a rebound or a reversal.
How to make the most of technical indicators
To make the most of technical analysis and to make informed stock trading decisions, traders should consider the following:
Understand how the indicators work for your situation
The first and most obvious way to make the most of your indicators is to use them in a way that makes sense to your situation, instead of following broad advice on how to apply them in your chart.
For example, you should determine the timeframe you want to use these indicators in, ranging from a few hours to a few days and weeks or even months. This depends on whether you are trading in the short or long term. It also depends on the volatility of the stock that you are trading.
Use technical indicators with other analysis techniques
To make more informed decisions, technical analysis alone will not suffice. Traders should branch out and learn how fundamental analysis and sentiment analysis work, and they should combine different analysis techniques to get the most accurateassessment of where the market may be going.
Apply risk management strategies
There is also the need to apply risk management strategies when trading stocks, no matter how solid you believe your analysis conclusions are. This means setting stop-loss and limit orders, so that your broker can help you close out your trades should the markets start performing in an undesirable manner. You should also make sure to use strategies like position sizing to make sure you are not risking too great of a percentage of your total capital.
Final words
Technical analysis tools are powerful tools for stock traders to use when it comes to identifying trends and potential turning points in the market. They can providea great way for traders to hone their skills and try out more complex strategies as well. However, they are not perfect, and traders should certainly not expect them to be foolproof. There is always the possibility of unpredictability in market behaviour of share prices. Therefore, traders should continue to do their due diligence by researching and evaluating companies before investing in their shares, keeping an eye on news updates, and never risking more capital than they can afford to lose.


Comments